请教matlab大神,为什么图例中线条颜色和画出来的曲线对不上呢??颜色种类和顺序都对不上,求教!
lamda = 1;k = 2*pi./lamda;theta = 0:0.001:2*pi;rho1 =(besselj(1,k*(lamda/20)*sin(theta))).^2;rho2 =(besselj(1,k*(lamda/6.28)*sin(theta))).^2;rho3 =(besselj(1,k*(lamda/2)*sin(theta))).^2;y1=rho1./max(rho1);polar(theta,y1,'r')set(polar(theta,y1),'LineWidth', 2);%设置极坐标系曲线宽度view(90, -90);hold ony2=rho2./max(rho2);polar(theta,y2,'g')set(polar(theta,y2),'LineWidth', 2);view(90, -90);hold ony3=rho3./max(rho3);polar(theta,y3,'b')set(polar(theta,y3),'LineWidth', 2);view(90, -90);hold onlegend('l=λ/20','l=λ/6.28','l=λ/2');title('E-Plane Power Patterns for Diffrent Loop Radius');set(gca,'FontName','Times New Roman','FontSize',20);

你这里polar函数可以改用polarplot函数,然后去掉set(polar(theta,y1),'LineWidth', 2)和view(90, -90)。
polarplot函数基本使用格式(适用于R2006a以上版本)
polarplot(theta,rho,LineSpec) 设置线条的线型、标记符号和颜色。
所以对于你的问题,可以这样来改
polarplot(theta,y1,'-r','LineWidth', 2),hold on
polarplot(theta,y2,'-g','LineWidth', 2),hold on
polarplot(theta,y3,'-b','LineWidth', 2)
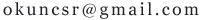
运行后的效果