求MATLAB的高手,怎么把两张仿真曲线合并显示在一张图上?
程序1%using pole placement-Ackermann%Modellinga=[0 1.0000 0 0;0 -0.1818 2.6727 0;0 0 0 1.0000;0 -0.4545 31.1818 0];b=[0;1.8182;0;4.5455];c=[1 0 0 0;0 0 1 0];d=[0;0];%Check the controllabilitydisp('The rank of controllability matrix')rc=rank(ctrb(a,b))%Designp=[-7.4527+9.666j,-7.4527-9.666j ,-3.1538+1.8334j, -3.1538-1.8334j]k=acker(a,b,p),x0=[0.2,0,0,0]%The close loop state system is denoted as (ac,b,c,d)ac=[a-b*k ];t=0:0.005:3;figureinitial(ac,b,c,d,x0,t)title(' initial respond of inverted pendulum system ')xlabel('Sec')ylabel('Output y=x3')figure[y,x,t]=initial(ac,b,c,d,x0,t);plot(t,x,'y')figure,x1=[1 0 0 0]*x',plot(t,x1);grid;title('x1的响应曲线') 程序2a=[0 1.0000 0 0;0 -0.1818 2.6727 0;0 0 0 1.0000;0 -0.4545 31.1818 0];b=[0;1.8182;0;4.5455];c=[1 0 0 0;0 0 1 0];d=[0;0];eig(a)Qc=ctrb(a,b);Rc=rank(Qc)if (Rc==4) disp('状态完全能控')else disp('状态不完全能控')endQo=obsv(a,c);Ro=rank(Qo)if( Ro==4) disp('状态完全能观测')else disp('状态不完全能观测')endQ=[25 0 0 0;0 0 0 0;0 0 81 0;0 0 0 0];R=1; K=lqr(a,b,Q,R);x0=[0.2,0,0,0];ac=[(a-b*K)];bc=[b];cc=[c];dc=[d];[K,P,e]=lqr(a,b,Q,R),t=0:0.005:7;figure initial(ac,b,c,d,x0)title('step respond of inverted pendulum system ')xlabel('Sec')ylabel('Output y=x3')figure[y,x,t]=initial(ac,bc,cc,dc,x0,t);plot(t,x,'y')figure,x1=[1 0 0 0]*x',plot(t,x1);grid;title('x1的响应曲线') 怎么样才能把这两个程序的XI 显示在一张图上
既然小编提到我了,我就好好看了一下程序,因为不确定画的其他图像是否有用,所以没删。最后一张图满足要求,修改如下:
a=[0 1.0000 0 0;0 -0.1818 2.6727 0;0 0 0 1.0000;0 -0.4545 31.1818 0];b=[0;1.8182;0;4.5455];c=[1 0 0 0;0 0 1 0];d=[0;0];
%Check the controllability
disp('The rank of controllability matrix')
rc=rank(ctrb(a,b))
%Design
p=[-7.4527+9.666j,-7.4527-9.666j ,-3.1538+1.8334j, -3.1538-1.8334j]
k=acker(a,b,p),x0=[0.2,0,0,0]
%The close loop state system is denoted as (ac,b,c,d)
ac=[a-b*k ];t=0:0.005:3;
figure
initial(ac,b,c,d,x0,t)
title(' initial respond of inverted pendulum system ')
xlabel('Sec')
ylabel('Output y=x3')
figure
[y,x,t]=initial(ac,b,c,d,x0,t);
plot(t,x,'y')
figure,
x1=[1 0 0 0]*x',
plot(t,x1);
grid;
title('x1的响应曲线')
T=t;
X1=x1; % 后面用
a=[0 1.0000 0 0;0 -0.1818 2.6727 0;0 0 0 1.0000;0 -0.4545 31.1818 0];
b=[0;1.8182;0;4.5455];c=[1 0 0 0;0 0 1 0];d=[0;0];
eig(a)
Qc=ctrb(a,b);
Rc=rank(Qc)
if (Rc==4) disp('状态完全能控')
else disp('状态不完全能控')
end
Qo=obsv(a,c);Ro=rank(Qo)
if( Ro==4) disp('状态完全能观测')
else disp('状态不完全能观测')
end
Q=[25 0 0 0;0 0 0 0;0 0 81 0;0 0 0 0];
R=1;
K=lqr(a,b,Q,R);
x0=[0.2,0,0,0];
ac=[(a-b*K)];
bc=[b];cc=[c];dc=[d];
[K,P,e]=lqr(a,b,Q,R),t=0:0.005:7;
figure
initial(ac,b,c,d,x0)
title('step respond of inverted pendulum system ')
xlabel('Sec')
ylabel('Output y=x3')
figure
[y,x,t]=initial(ac,bc,cc,dc,x0,t);
plot(t,x,'y')
figure,
x1=[1 0 0 0]*x',
hold on
plot(T,X1,'r');
plot(t,x1);
grid;
title('x1的响应曲线')
legend 程序1的响应曲线 程序2的响应曲线
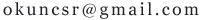
两张图时间轴不一般长,但能画。需要的就是最后一张图,如下: